
Google Analytics Enhanced eCommerce is a tool helping you answer the question WHY not only WHO. Alongside with the default functionality of Google Analytics, now you can form more specific reports on shopping behavior. By doing this you will make a huge step towards understanding your customers much better.
The difference is that with the GA Enhanced eCommerce add-on, you are not standing in front of the store entrance watching customers coming in and out, trying to analyze the crowd—what they watch, where they go, and who they are. Now you are the center of the scene focusing on the reasons for their actions. All that sounds a little mysterious but it is not. Keep reading for more details.
What is GA Enhanced eCommerce Add-on?
It is a professional solution for CS-Cart stores, which allows tracking additional information about customers, like when customers add items to cart, start the checkout process, complete a purchase, and many more. The add-on analyses the products, not only traffic. Revenue, conversions, transactions, top sellers, product lists or categories effectiveness, promotion instruments, and affiliation related features, details of customers interaction with checkout and cart.
Why You Need It?
By implementing Enhanced eCommerce, you get more insights that will give you more opportunity for improvements. You will know everything about:
- the effectiveness of product lists, catalogs, and block features in your store. (For example, the block of “recommended” or “most viewed”goods). Maybe you need to revise your merchandising or keep up with a trend.
- interactions with cart (adding, deleting, viewed/sold ratio). Find out where and why your customers change their mind.
- shopping behavior. View all steps the customer goes through prior to a purchase (going through a product page, shopping cart page, checking the delivery address, choosing a shipping method or a payment method). Maybe you can shorten the way your customer travels and make the purchase process quicker.
- overall visits, product views, cart additions, number of purchases, promotion stats. All major stats in a single place for a quick overview.
Read this article to know more opportunities for using GA Enhanced.
Enhanced Reports Available
There are many reports that can be made but we will review the most notable ones.
Overview
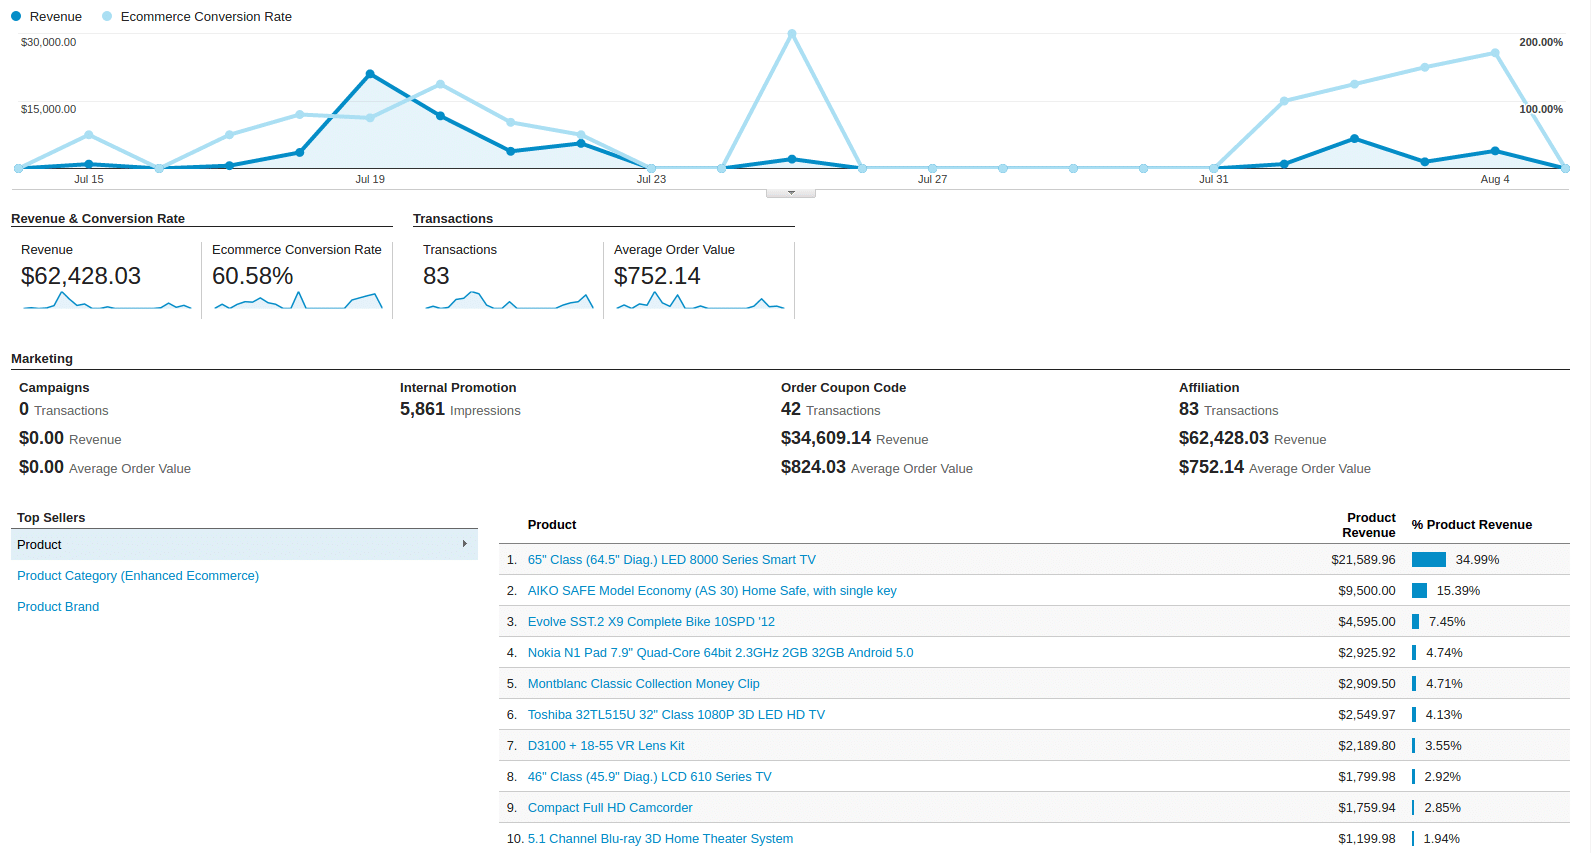
The Overview report lets you see the overall state of your business and provides three categories of related metrics:
- Revenue and Conversion Rate – the total revenue from web eCommerce or in-app transactions. eCommerce conversion rate — the percentage of visits that resulted in an eCommerce transaction.
- Transactions – the total number of completed purchases on your site.
- Marketing – statistics about Campaigns, Order Coupon Code, Affiliation.
Shopping Behavior
The Shopping Behavior Analysis report allows you to track customers as they walk through the entire sales process. It lets you see the number of sessions at each stage of your purchase funnel, how many sessions continue from one step to the next, and how many abandon the funnel at each stage. Where the funnel indicates abandonment (a red arrow at the bottom of a step), those users do not complete any additional steps of the funnel during the same session.
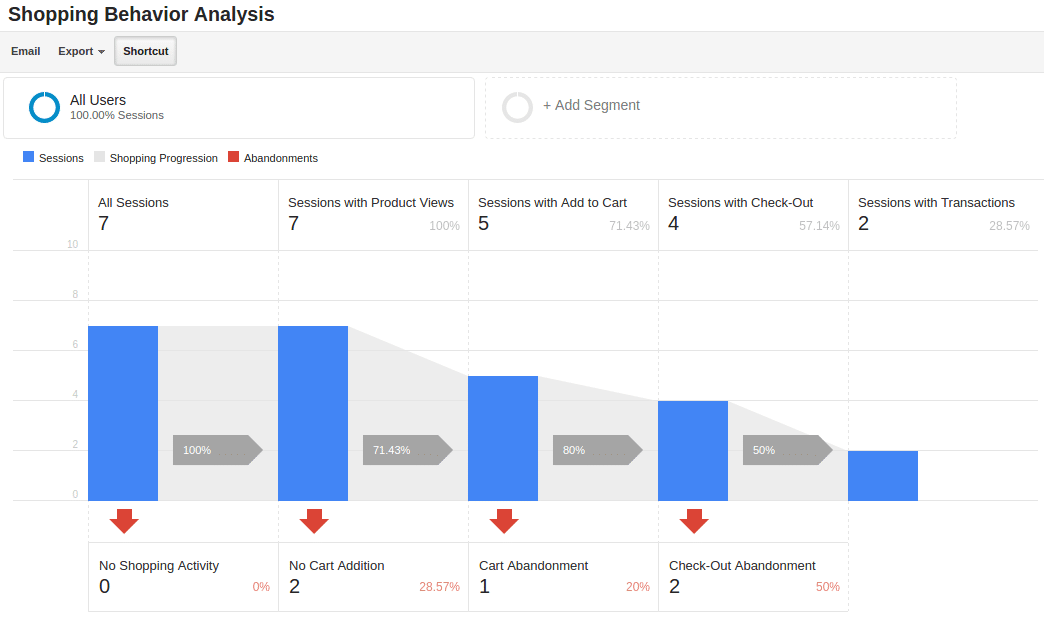
This report helps you analyze the steps with the highest abandonment rates. Basing on this information, you can identify the pages with the lowest conversion rates and take possible actions to change the situation.
Shopping Behavior is divided into five steps or visitor categories. This segmentation is the basis of enhanced analysis and you cannot change or rename them but you can create segments within these basic categories. For that click the block below each basic category.
Below there is a table with additional information about visitors. It shows geographical, gender or technical analysis.
Checkout Behavior
The checkout procedure is not just one red button, which completes the purchase. It is a complicated process where visitors perform actions and make decisions. The Checkout Behavior Analysis report gives you a clear overview where exactly in the checkout process most of your consumers are leaving.
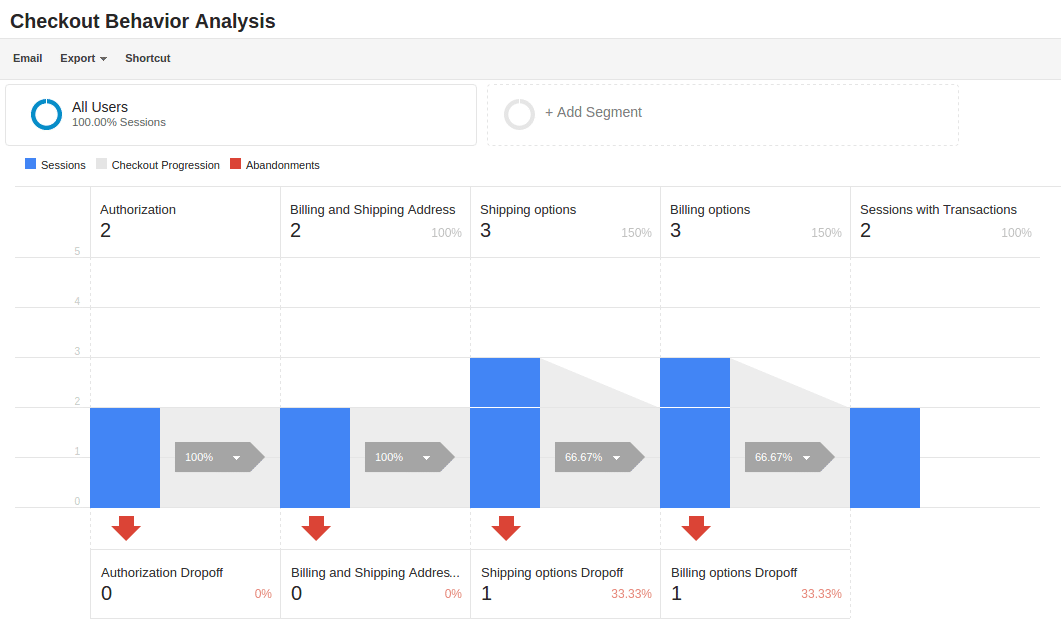
The report lets you see how the users move through your checkout process. The checkout funnel visualization illustrates how many users move on and how many abandon the process at each step.
Basing on the data obtained from the report, you realize which step is responsible for abandoned carts. Is it an authorization page or shipping options? Maybe you need to consider anonymous shopping option or revise your shipment partners alongside with the payment gateways you use.
Product Performance
The Product Performance report shows the sales performance and shopping behavior related to your products. This report offers multiple dimensions to view the data, such as Product, Product SKU, Product Category, Product Brand. The goal is to let you analyze product performance based on how your company organizes them.
Another new feature of the Product Performance report is Refund record. From now on you know exactly which product was refunded but not only the total amount of refunds.
Sales Performance
The Sales Performance report lets you evaluate sales by either of two primary dimensions:
- Transaction (date, time, transaction ID)
- Date (cumulative transaction data by date)
The Sales report became rich with information. The default revenue overview can be filtered to see every transaction detail or specific date transactions or any product related transactions. Go on and compare your revenue and shipping costs on a diagram. Watch the progress of each feature in dynamics. Do not forget about secondary dimensions, which gives you even more insights into your audience and your sales.
Product List Performance
The Product List Performance report helps you understand how merchandising blocks, category pages or search results lead to product demonstration and how often users click on specific products.
Every online store has at least one product list of “all products”. Advanced stores or marketplaces in addition use lists like “people also buy”, “recommended to you” or “bestsellers”. These lists are made to stimulate the customer’s desire to make a purchase. Enhanced eCommerce enables you to monitor and analyze the efficiency of such lists – which list demonstrates more products to visitors, which one is more clickable or brings you more revenue. If you choose one of the lists, you will see the details of which product from this list. How many views, clicks, additions, and transactions.
For example, red shorts from “men’s clothes” list do not perform well just like red skirts from “women’s clothes”. So why don’t you add them to your “sale” list and start a “red sale” campaign with a 50% discount to get rid of them?
Marketing
Internal Promotion
This section provides an overview of the eCommerce performance of your internal promotions— those which take place in your store. Like ad banners, which you can use to inform your visitors about “RED SALE” by the way.
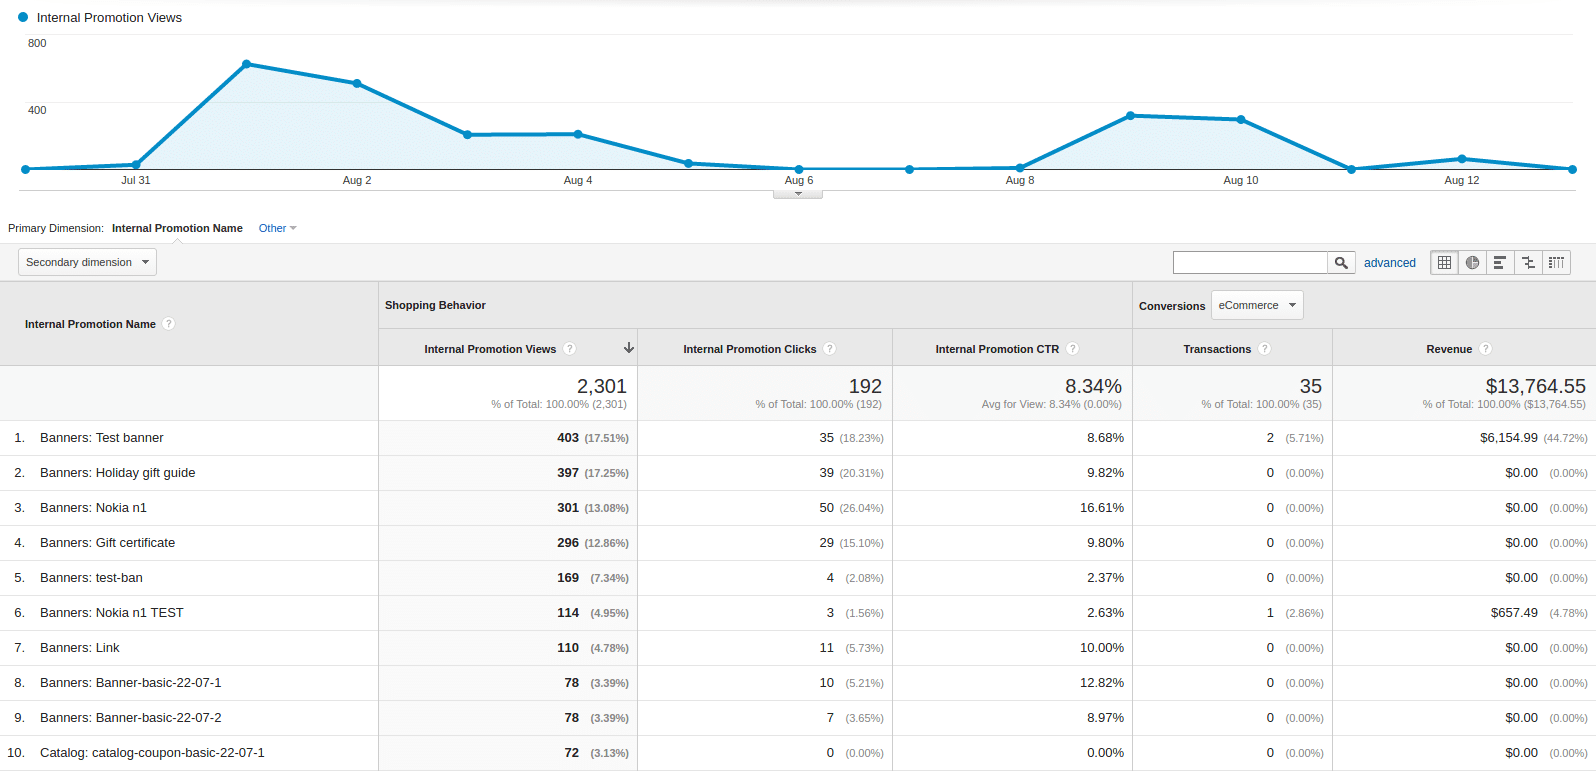
The report shows you how many times the visitor saw this promotion, how many times they clicked and CTR as well.
Collect data and search for the best place for your promotion. And remember, clicking on a banner takes a visitor away from the page, so choose wisely—no banners on checkout!
Coupons
The Order Coupon, or Product Coupon report, provides an overview of the eCommerce performance of your promotions.
The reports provide you with information on your revenue, purchases, transactions, average order value and revenue per purchase.
One thing you should note. One unique purchase can be a part of a transaction along with other unique purchases.
Analyzing your coupon promotion you can find out that some promoted products are bringing you more revenue with fewer transactions than the others. One sold TV can give you more than ten batteries for remote control.
Affiliate Code
This section provides an overview of the eCommerce performance of your external promotions via affiliate websites. The more affiliates you have, the better. That’s what they say. But the Enhanced Affiliate Report can tell you more. With secondary dimensions, you can analyze different markets your affiliate partners are in and search for perspectives of your main store impact.
Say, you can see your partner makes a huge revenue month after month. Click on his name in the report and find out what he sells best, add geographical dimension to locate clients, add traffic type dimension or behavior dimensions and reveal your new destination for your business to grow. You do not want to overwhelm your partner? Good, then support him! If thanks to the Affiliate report you see his sales are doing well, expand your products range to give your partner options for related sales. Your call.
Install Google Analytics Enhanced eCommerce Add-on
To prevent you from hard times coping with coding, we created the Google Enhanced eCommerce add-on for CS-Cart stores. All you need to do is simply install the add-on, get a Tracking id from Google Analytics and enjoy all the useful features of Enhanced eCommerce.