
Performance issues can significantly deteriorate your store perception with customers. You can sell the best-in-the-world goods and have a lucrative and a well-thought UX/UI design, but problems with the webpage loading speed, odd add-ons behavior, or image distortion would nullify all your efforts to make your business profitable. Of course, your IT team helps you to find and fix bugs before it’s too late. However, online retailers and eCommerce brand owners should have a guide to be able to quickly adopt all the rescue measures and fix bugs on their own. Our developer team gathered the most common causes of CS-Cart’s poor performance and low-speed operation. With this guide, you’ll be able to improve your website performance without paying a cent.
Cache
Reason: ‘Rebuild cache automatically’ is on.
How to check: Administration Panel (Top Menu) → Design → Themes
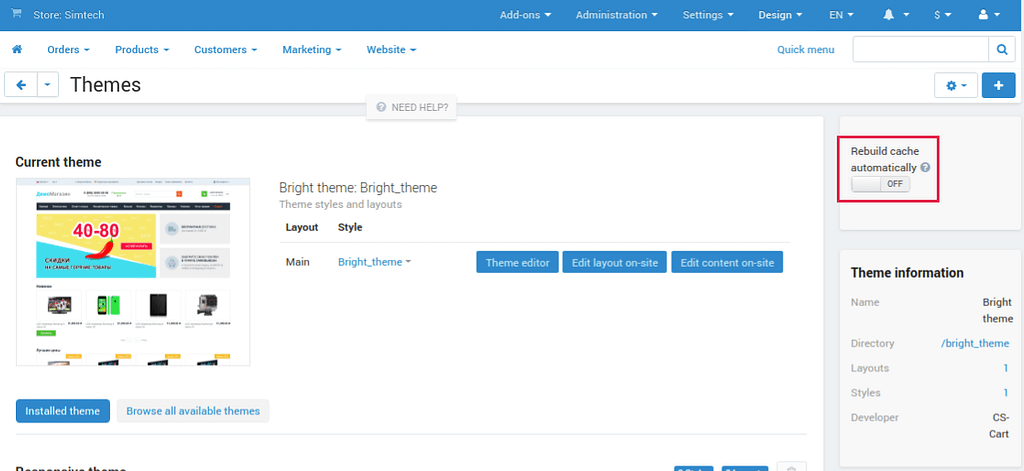
This setting allows you to enable an automatic clear cache in CS-Cart. It’s an important setting when you make changes to your website. However, it may affect the speed of loading pages. You should turn it off if no development is done on your website.
If you have access to the store’s root directory, it is recommended to check if the local_conf.php file has the following line:
$config['tweaks']['disable_block_cache'] = true;
CS-Cart caches blocks to reduce page loading time. However, the code that disables block caching could have been left by the developer by accident. Here is the way to fix it:
$config['tweaks']['disable_block_cache'] = false;
or
// $config['tweaks']['disable_block_cache'] = true;
Images
Reason: big-size images
How to check: test your website with the Google Page Speed service or right-click the picture in the browser and select ‘Inspect Element’.
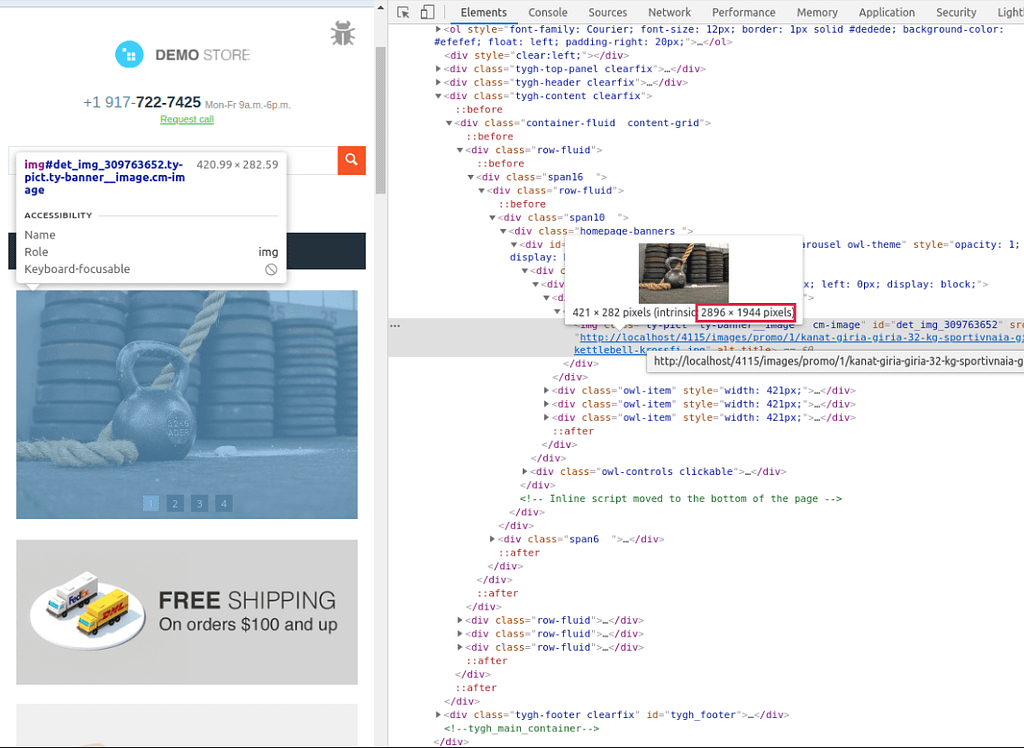
A console with the HTML code opens. The required image link will be highlighted on it. Mouse hover over the image link shows its actual size.
Images should be optimized for the web. Heavy images can affect the page loading time. It is critical for pages with lots of images.
There are services that allow you to reduce the size of the image without any visible loss of quality.
Add-Ons
Reason: Add-ons are not designed for a large number of entities (like products, brands, etc.). Custom themes may be unoptimized and run slow.
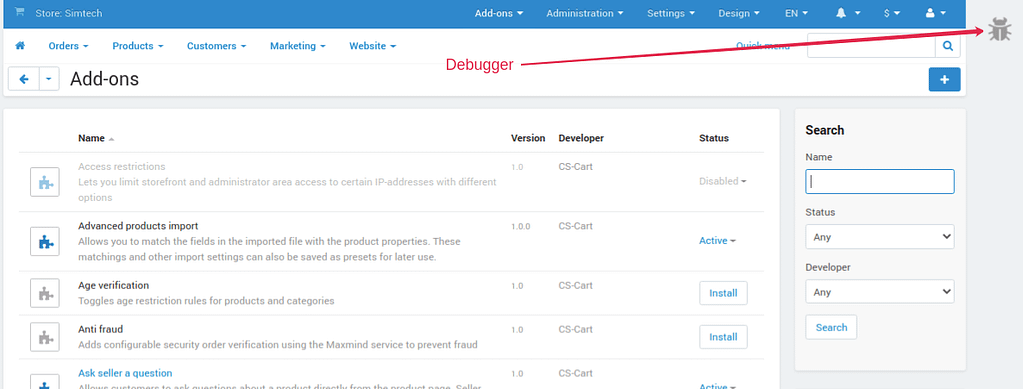
How to check: Use the debugger to check the page load speed and the number of database queries.
Enable debugger
CS-Cart has an in-built developer tool that allows you to estimate the number of queries to the database for that page.
The root administrator of the website can activate the debugger by adding the debug parameter to the address line:
or
The debugger will be active both for the admin panel and the storefront. At this, for storefronts using another domain name, you will need to extend the storefront URL with debug=*debugger_id*
When you open the debugger using this way, it will display temporarily in the browser for the administrator only.
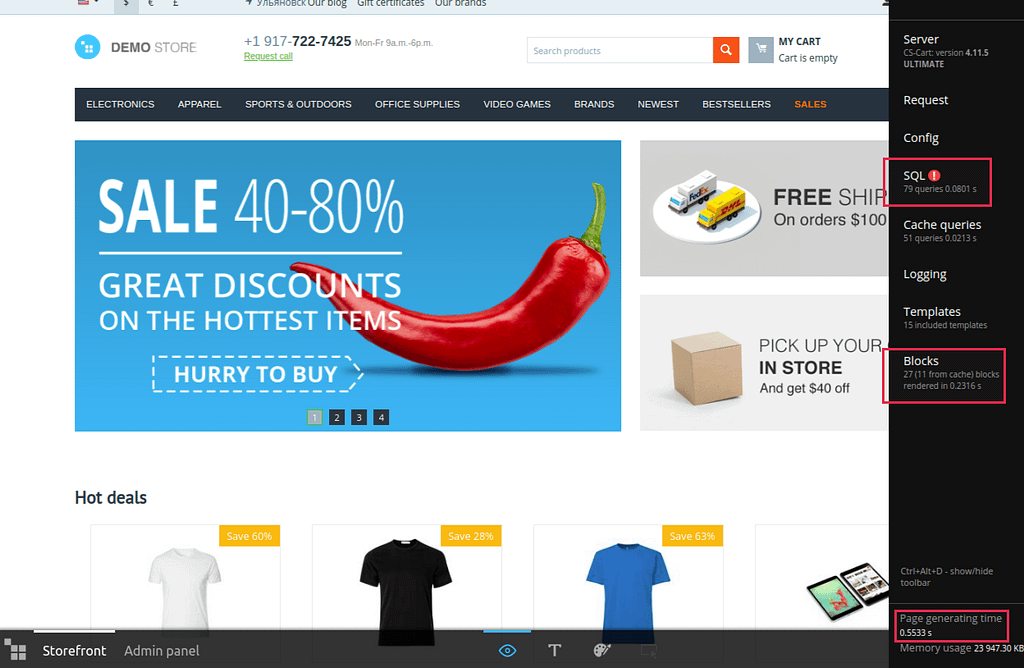
Where to find debugger: Find it in the top right corner of the page with the ‘bug’ icon.
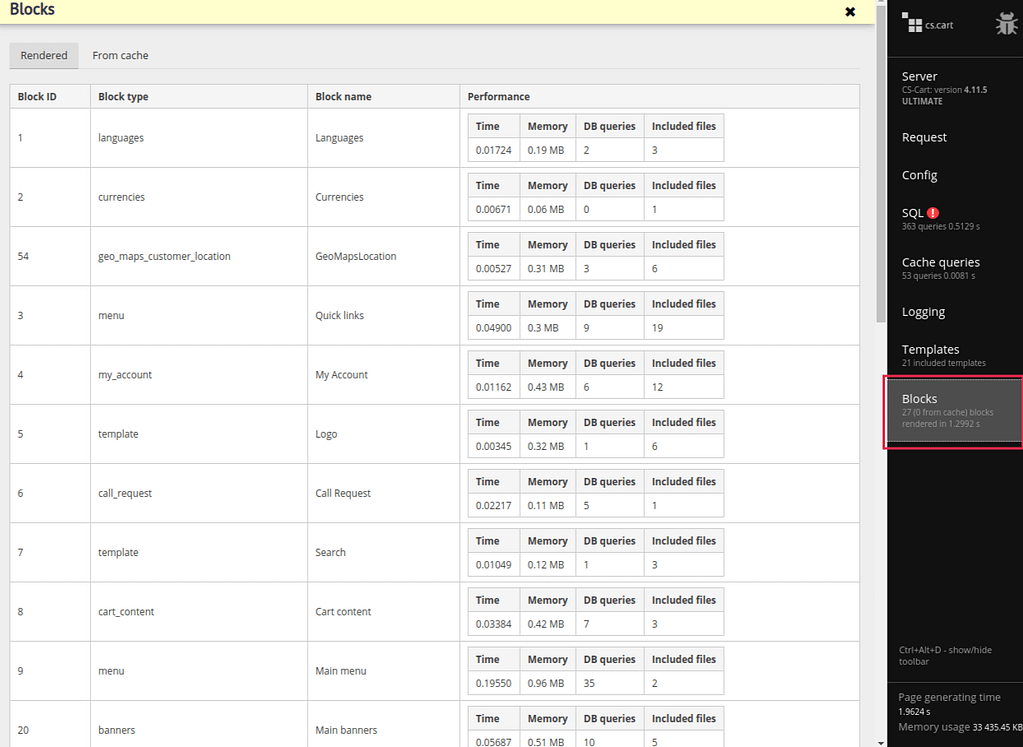
The page generation time is shown at the bottom of the page together with debugger_id
The SQL tab specifies the number of queries to the database and the query runtime. The Blocks tab shows the loading time for particular blocks on the page.
Acceptable values may differ depending on a project. We recommend doing these checks regularly to track the state over time.
Isolate the problem
If the page loading time and/or the number of database queries exceeds the desirable value, try to find the root cause.
This can be due to an add-on that sends many queries to the database.
In projects with fewer instances to be processed, such an add-on won’t significantly affect the performance and will go unnoticed. But if there are tens or even hundreds of thousands of them, the processing time may become unreasonably long, reducing the website performance.
- With the understanding of how the add-on should function, you can see whether it runs or not on the page (for example, it adds new features, images, or makes changes in some other way).
- On the SQL tab, you can see to what database table a request is sent, and what is the runtime for each specific request.
- Also, the Blocks tab on the storefront shows the runtime for every block and how the memory is consumed.
Disable the add-on and check the performance
Add-Ons Tab > Manage Add-Ons.
How to check: Open again the affected page and test the loading speed and the number of queries.
Tip: When an add-n is turned on / off, the cache is partially cleared. We recommend refreshing the page first before you go into testing.
If the number of add-ons is big, you can disable all third-party add-ons. Once you disable them, check the store performance by re-enabling the add-ons one by one and monitoring the time when the load increases.
Cron job and third-party service synchronization
Poor performance may be caused by processes performed with cron, like creating database backups or sending requests to a third-party service to get or synchronize data.
Solution: Set all processes performed with cron to the time when the store traffic goes down according to analytics.
Key takeaways:
- Caching makes pages load faster. Make sure it is on.
- Graphic elements affect website performance. Check the size of the images.
- Use the debugger to isolate problems. Disable the suspicious affected add-on and test the performance when it is off.
- Examine the time consumed by cron tasks. Schedule them at a least-loaded time.
Metrics to check:
- Page generating time should not exceed 0.0483 s:
- If it exceeds 0.5 s, then you’ve got issues with the code and SQL queries.
- SQL queries should be not more than 218 queries with an average time of 0.0668 s per request:
- If queries are more than 500 requests, the issue is within the code;
- If a request takes more than 0.2-0.3 s, then issues are within the code and SQL queries.
- 20 (0 from cache) blocks should be rendered for 0.2736 s:
- If 0-5 blocks are from the cache, there may be issues on the code side (the caching system is broken)
- If rendering lasts more than 0.5 s, then issues are within the code and SQL queries.
Closing
Performance optimization can contribute to your online business success. It is critical to find the reason why your eCommerce site has poor performance. Our developers can help you there and perform a full check of your server environment to advise the settings that will work best for your store, isolate all the bottlenecks due to incorrect or unoptimized settings of your CS-Cart or Multi-Vendor store, and fix these problems for you. We are an expert team with a huge experience in finding bugs and optimizing performance. While we analyze page load time and make a detailed report based on the analysis, you can do business and focus on growth.